Hello everyone! I apologize for the delay in posting. Medical challenges, working on a small business, and getting ready to pay for college are no joke. I won’t make promises. I’ll do my best to post once a week. Thanks for sticking with us while we were on hiatus. I am proud to have kept the blog ad-free. Today, we’ll cover the roller coaster ride of Nvidia on a monthly, weekly, and daily level.
Note: We are investors in Nvidia. When I say “we” that means myself (smilingdad) and my family. The share count we own is barely visible.
Nvidia on a monthly chart
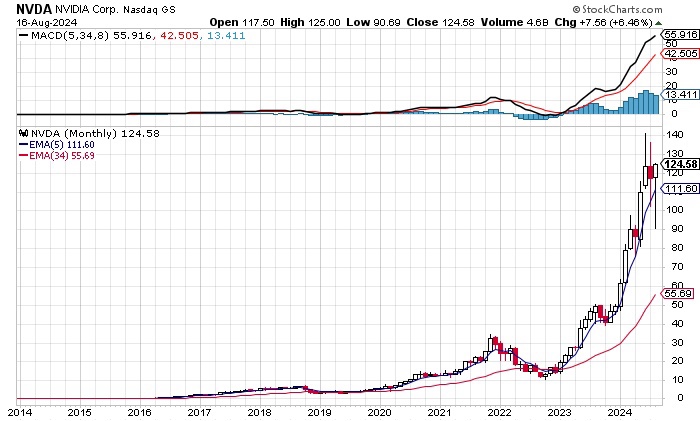
It is easy to see that since 2023, Nvidia’s stock price has been exponentially rising. The stock went to $10 to $125. I am always wary of exponential stock growth, as it is rare that exponential earnings are sustainable (see Tesla from a few years ago). Demand for Nvidia’s AI processors keeps increasing. Nvidia as a company remains disciplined in bringing valuable products to market.
No sell signal was given on the monthly chart. As a recap, that is when the difference between the 5-month exponential moving average and the 34-month exponential moving average over the last 8 months goes negative. We see the black line above the red line in the top frame.
You can use the 5,34,8 MACD indicator on the free daily and weekly charts on Stockcharts. You won’t be able to see monthly charts without a membership. You can apply the indicator to individual stocks, index funds, bonds, currencies, or commodities. Collective human emotions remain the same regardless of investment or timeframe. We do recommend buying and selling on the monthly charts.
5, 34, and 8 are all Fibonacci numbers. (2+3=5, 3+5=8, 5+8=13, 8+13=21, 13+21=34). I don’t know why, but the stock market resonates with these numbers. The 5 ema and 34 ema give you a good difference between unsteady short term movement and longer term steadier movement. We can exploit those to buy good stocks at a discount, and sell expensive stocks at high prices.
“I’m talking to the big companies, and the big companies are telling me they need $20 billion, $50 billion, $100 billion — very very hard,” said Schmidt, adding that he’s a “close friend” to OpenAI CEO Sam Altman.
Schmidt suggested a huge amount of this spending was going to Nvidia, which makes the dominant data center AI chips, and has already seen revenue increase by more than 200% for three straight quarters.
Eric Schmidt, former CEO of Google on CNBC
Schmidt continues by saying much of this money may go to Nvidia. Such large sums will attract competition. Our current market and exonomic structure rewards oligopolies.
“If $300 billion is all going to Nvidia, you know what to do in the stock market,” Schmidt said. “That’s not a stock recommendation.” Schmidt didn’t say if he owns Nvidia shares.
Eric Schmidt, former CEO of Google on CNBC
Nvidia on a weekly chart

Not all has been rosy with Nvidia’s weekly chart. From June to August, the stock peaked at $140, before moving to $95, and rebounding to $125. A sell signal was given in early July. A new weekly buy signal has not been generated yet. I can tell you numerous times that buying before a buy signal is triggered may lead to the stock declining again and holding losses. Make sure to have a stop loss in place!
Momentum has to confirm the move higher is solid. I don’t use weekly charts, as you will get whipsawed mightily. We are sharing to see the trend. Corrections of 30% to 60% are common in fast growing stocks. Bear markets have the most violent moves down and up. The stock market will overshoot up and down and revolve around true value. If the weekly chart makes a buy signal soon, I expect we’ll challenge new highs. The fear of missing out will be too high.
Nvidia on a daily chart
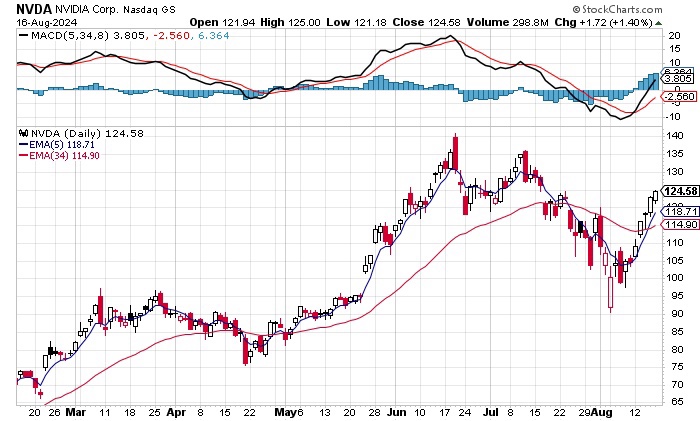
The daily chart did a decent job getting you out and getting you back in. You will never capture the exact top or the exact bottom. Anyone that claims to do so via some super secret method is trying to trick you out of your money. The latest sell signal was triggered in mid-June around 130. There was a quick buy signal and reversal in early July. A durable buy signal was not given until early August around $110. The closer to 0 or below when the buy signal is given, the higher the confidence we have that momentum is wiped out and sellers are exhausted. I am not entirely convinced that the move higher is durable. We may enter a trading range, where both bulls and bears lose money leaving everyone utterly confused.
Two notes of caution. Trading in a taxable account may lead to high short term capital tax rates. Longer term capital tax rates where you hold over a year are lower than short term tax rates. We use the daily chart as a good place to buy stocks we want to own. Second, numerous studies have shown that trading less leads to higher overall returns. Third, other studies show women are better long term investors than men. Always consult a trained financial professional for advice.
Wish you a Happy Sunday! If you have any investments you want us to write about, leave us a comment below.
Sincerely yours,
smilingdad
Copyright ©2017-2024 smilingdad. Copyright ©2023-2024 PokeAshVMax. All Rights Reserved. The content produced by this site is for entertainment purposes only. Opinions and comments published on this site may not be sanctioned by and do not necessarily represent the views of smilingdad, its owners, sponsors, affiliates, or subsidiaries.
