Written on December 13th, 2023
At the end of last quarter, we did an investing wrap up. It was popular. https://smilingdad.blog/2023/10/01/invest-third-quarter-wrap-up/ With news out today that the Federal Reserve didn’t raise rates, let’s look at QQQ, oil, gold, and US Treasury 10-Year bonds today.
QQQ


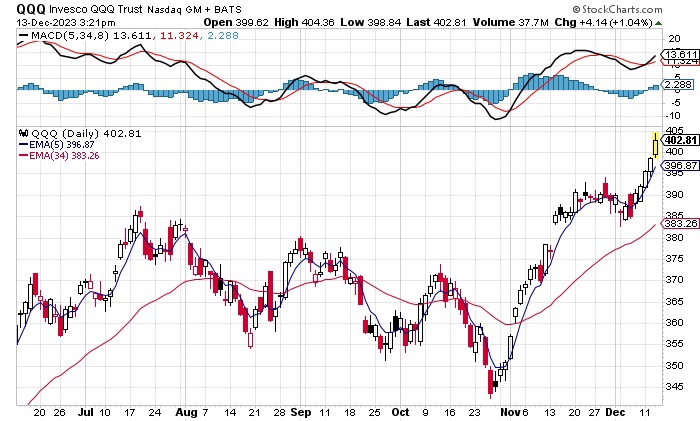
On all three time frames, monthly, weekly, and daily, QQQ has given a buy signal. A buy signal is when the black line goes above the red line in the top panel. It uses the difference between the 5 period exponential moving average and the 34 period exponential moving average over the last 8 time periods to provide a signal. The monthly chart shows 400 was the resistance level before a nasty correction took place last year. We exceeded the 400 level for the first time today in 2 years. If the 400 level holds, QQQ will move higher. A daily buy signal was given in mid-December.
Note: We have some bullish put spreads on QQQ expiring this week. We have 1 long Jan call on QQQ.
Gold
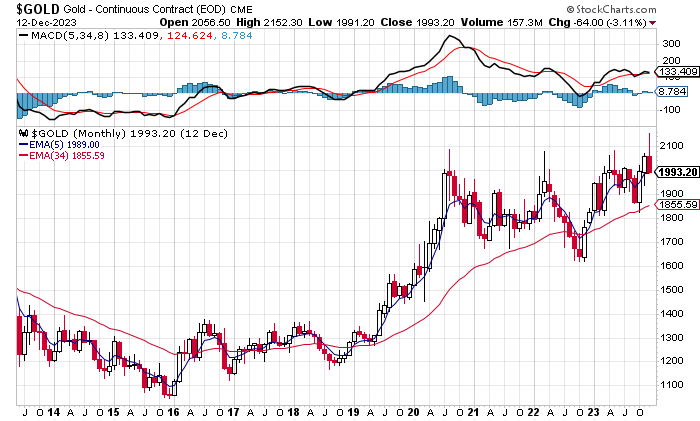
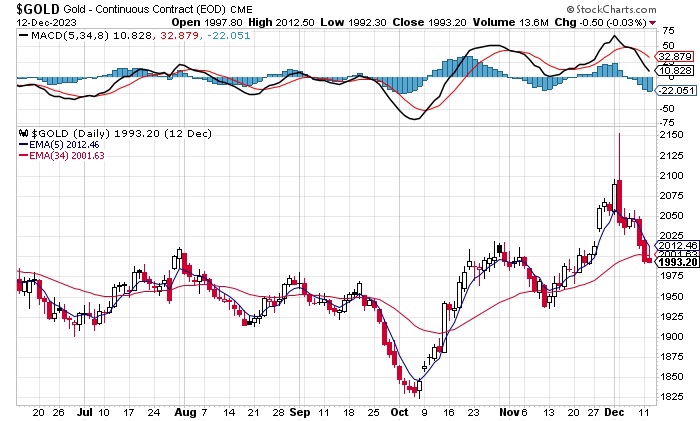
After a buy signal earlier in the year, gold is treading steady on a monthly chart. A clear trend to buy or sell is not available. On the daily chart, we can see the move to 2150 and the violent move to sell in December. No short term or long term buy signals for gold. If critical support at 2000 doesn’t hold, gold has support at 1950 and 1825.
Oil
With the news today that 200 countries clinched a deal to move away from fossil fuels, the long term future for oil and natural gas is bleak. See here via our gift link: https://wapo.st/3TiHCot Countries clinch unprecedented deal to transition away from fossil fuels
Oil looked to be heading higher in our 3rd quarter update, then quickly gave a sell signal.
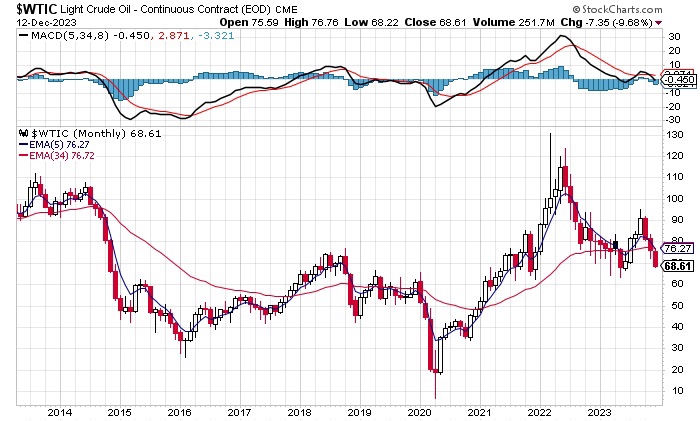

Oil peaked in late September close to 94, triggered a sell signal soon after and now trades at $68. We continue shorting Exxon and Chevron via bearish call spreads when opportunities come up. No active positions currently. If you used the monthly charts to sell, you would have had a small loss. Profit gouging by oil and other companies led to a higher inflation rate last year. Their refusal to embrace solar, wind, geothermal, electric vehicle charging or long term energy storage makes them a consistent short for us over the next decade.
10-Year US Treasury Yield
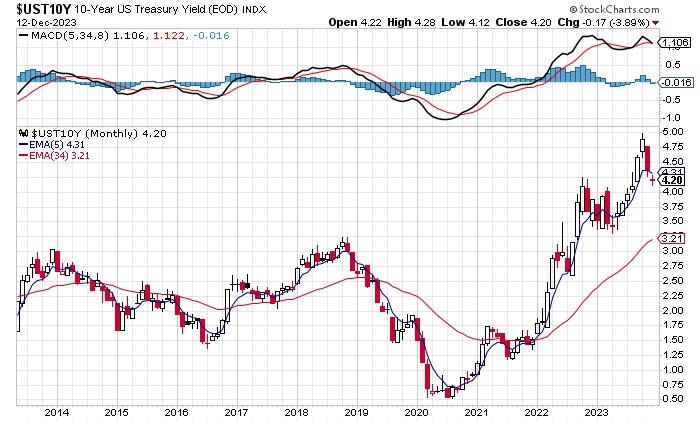
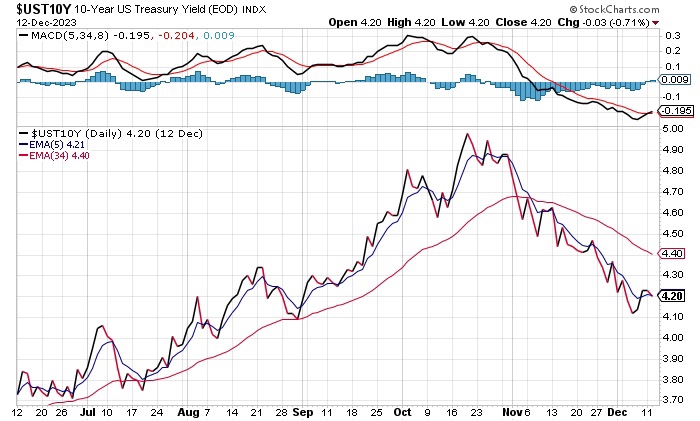
We expected long term rates to go up at the end of September. They peaked at 5%. A sell signal on a daily chart was given in late October. Rates declined from 5% to 4.2%. Good news for anyone having variable rates or seeking a loan. A weak buy signal has been generated on the daily chart. It is time for us to buy some 6-month government bonds before short term rates decline over the coming year. Some stabilization of long term rates at the current level seems likely before a trend resumes.
Thanks for reading!
Sincerely yours,
smilingdad
Copyright ©2017-2023 smilingdad. Copyright ©2023 PokeAshVMax. All Rights Reserved. The content produced by this site is for entertainment purposes only. Opinions and comments published on this site may not be sanctioned by and do not necessarily represent the views of smilingdad, its owners, sponsors, affiliates, or subsidiaries.
