Published on: October 1st, 2023
Starting this quarter, we’ll do an investing wrap up as the quarter ends. We’ll cover major stock indices or proxies, bonds, commodities, currencies, crypto and anything else interesting. We covered our approach on how to own stocks with less stress here: https://smilingdad.blog/2022/02/23/own-stocks-with-less-stress/
Stocks

After a rough 2022, the S&P 500 (SPY proxy) staged a strong recovery in 2023. The past month has been a doozy, with losses running almost 5% down. In the upper panel, the SPY gave a buy signal early in the year (black line crossing above the red). We’re not at a sell signal, yet. The sell signal will occur when the black line crosses below the red line on the top panel. The previous sell signal came after an almost 2 year run higher. The stock market faces headwinds, with inflation remaining high but decreasing, and interest rates climbing sharply. High interest rates should decrease the value of stocks.
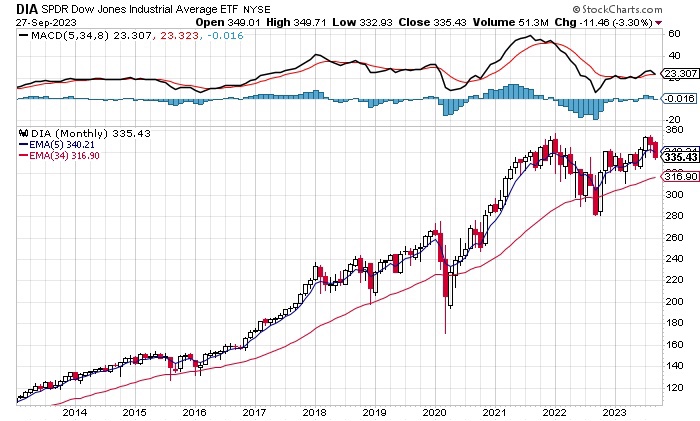
The Dow Jones Industrial Average includes 30 well-known companies. Companies include Apple, Pfizer, JP Morgan Chase, and Coca-Cola. Since a weak buy signal was generated early in the year, the Dow has bounced around in a small range. A sell signal looks imminent on the monthly chart. I wouldn’t expect a big move down if it happens.

QQQ is a proxy for the Nasdaq 100. The AI book has done well to boost QQQ (Nvidia is a member). A buy signal was given earlier to start this year. Some temporary weakness in September. No confirmed sell signal yet.
Bonds
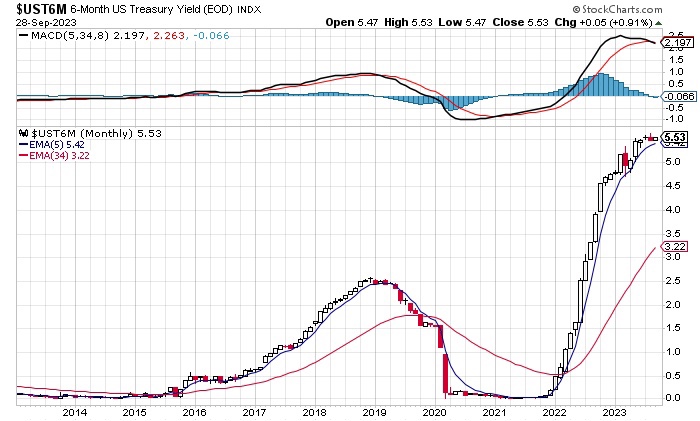
From the above, we see 6-month yields have exploded higher the last two years. The MACD indicator in the top panel is close to a sell signal. That might mean the pace of interest rate hikes slows down from here. The best way to get the rates you want is buying bonds at Treasury Direct. Short term Exchange Trade Funds are a good way to participate. You’ll note 5.53% for a 6 month T-bill is higher than most CD’s over one year. It’s higher than we get from Sofi (4.50%) or Apple Savings (4.15%). Might be time to move some money over.
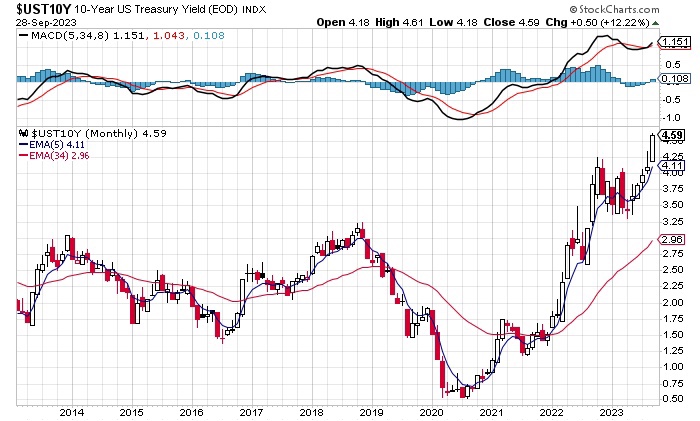
10-Year US Treasury yields are at an interesting place. On a monthly chart, yields have given a buy signal. Which means yields are expected to go up. Yields are currently lower than at 6-months, a situation known as an inverted yield curve. The Federal Reserve controls short term rates. The market controls long term rates. Since mortgage rates are linked to 10-year rates, be careful if you want to buy a house. It doesn’t make sense to lock in your money for 10-years if rates are going up.
Investopedia (2)
- An inverted yield curve occurs when short-term debt instruments have higher yields than long-term instruments of the same credit riskprofile.
- An inverted yield curve is unusual; it reflects bond investors’ expectations for a decline in longer-term interest rates, typically associated with recessions.

TIPS stand for Treasury Inflation Protection Securities. It was hard to get a 10 Year TIPs yield chart. This was the best one I found. TIPS yields are back to where they were in 2009. The lower yields offered compared to regular 10 Year Treasury Bonds is because of the regular inflation adjustment.
Unlike other Treasury securities, where the principal is fixed, the principal of a TIPS can go up or down over its term.
When the TIPS matures, if the principal is higher than the original amount, you get the increased amount. If the principal is equal to or lower than the original amount, you get the original amount.
TIPS pay a fixed rate of interest every six months until they mature. Because we pay interest on the adjusted principal, the amount of interest payment also varies.
Treasury Direct
With a little math, (1.0459)/(1.02241) – 1 gives us 2.3% a year. That’s (1+ the 10 yr yield)/(1+ 10 yr TIPS yield) – 1 gives us the annual inflation rate we need to have for the TIPS to make sense. We don’t have an MACD indicator to give a buy signal. If we did, I’m sure it would say TIPS yields are going up.
Commodities
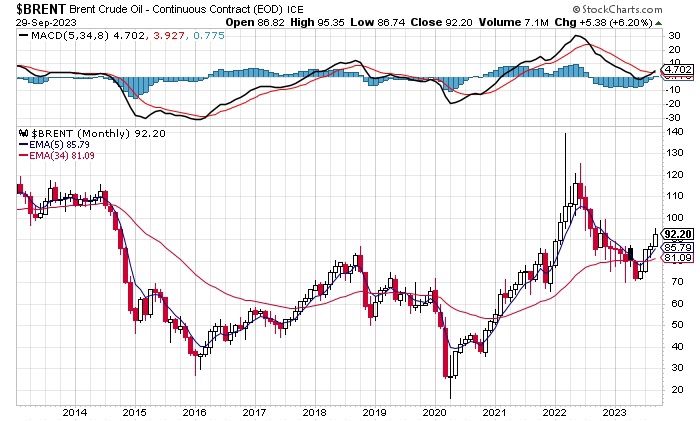
Brent Crude is about to enter a bull market. A buy signal has been registered on the monthly charts. That’s bad news for anyone that uses gasoline, diesel, or jet fuel. Saudi Arabia is actively cutting oil production to keep costs high. We actively avoid oil and natural gas stocks because of the climate pollution and take small shorts when the market is right. Given rising gasoline costs, it would make sense to get an electric vehicle if you can and to switch to heat pump furnaces.

It was a brutal month for gold. The move this month triggered a sell signal. It’s not good for gold if interest rates stay higher for longer. That increases the strength of the US Dollar, which decreases demand for gold.

Silver is very close to a sell signal. We might see it happen early this week. The price looks range bound. No strong momentum either way.
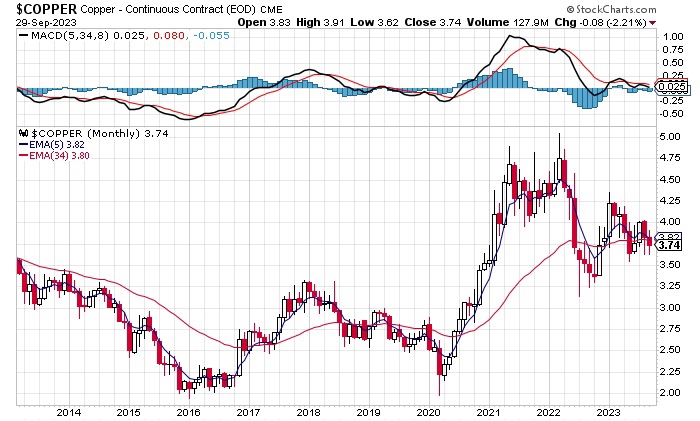
Dr. Copper gave a mild sell signal. Copper seems to be in a narrow range. Copper is used in many materials. It is a proxy if the world is doing well or not. The US has recovered the strongest. Others are facing high inflation and high interest rates, classic stagflation.
Currencies
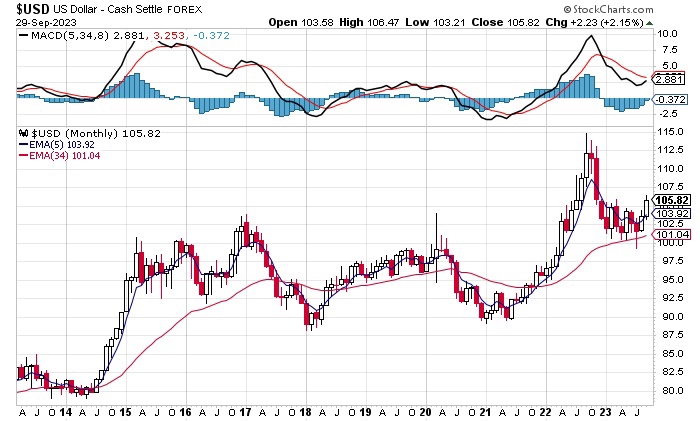
The US Dollar index is getting stronger against other currencies. That means it is cheaper for the US to import and more expensive for everyone else to import. There is some benefit that it is cheaper for everyone else to export to the US.
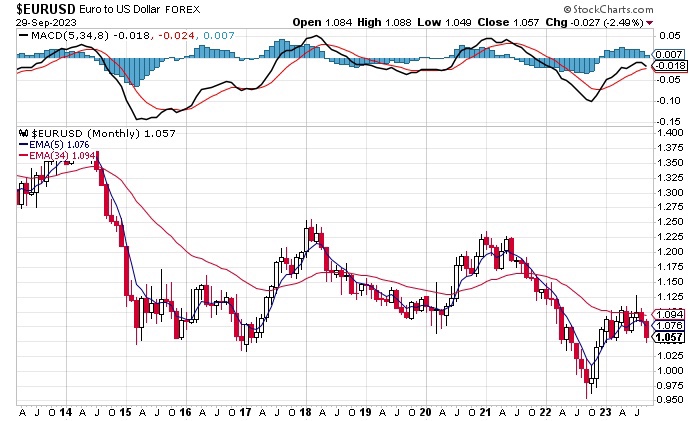
We see that in the Euro to US Dollar chart. One € only buys $1.06 Dollars. As recent as 2021 the Euro bought $1.20. A sell signal is about to be triggered. It may be possible for € = $ soon. Sorry Europe! Get ready for a wave of American tourists.
Crypto

Bitcoin is simply existing at this point. That’s impressive, considering it pays no interest, like gold. A buy signal was generated near the beginning of the year. We have sold all our crypto at this point at SoFi and Gemini. It’s all paper speculation. It doesn’t add any value to the world or solve any problems.

Ditto for Ethereum.
Thanks for reading. Any investments you would like us to cover for next time?
Sincerely yours,
smilingdad
Copyright © 2017-2023 smilingdad. The content produced by this site is for entertainment purposes only. Opinions and comments published on this site may not be sanctioned by and do not necessarily represent the views of smilingdad, its owners, sponsors, affiliates, or subsidiaries.
Notes:
(1) smilingdad Own stocks with less stress https://smilingdad.blog/2022/02/23/own-stocks-with-less-stress/
(2) Investopedia Inverted Yield Curve: Definition, What It Can Tell Investors, and Examples https://www.investopedia.com/terms/i/invertedyieldcurve.asp
(3) Trading Economics United States 10 Year TIPS Yield https://tradingeconomics.com/united-states/10-year-tips-yield
(4) Stockcharts https://stockcharts.com
